
Tile Experience: Trebling Revenue in Five Years
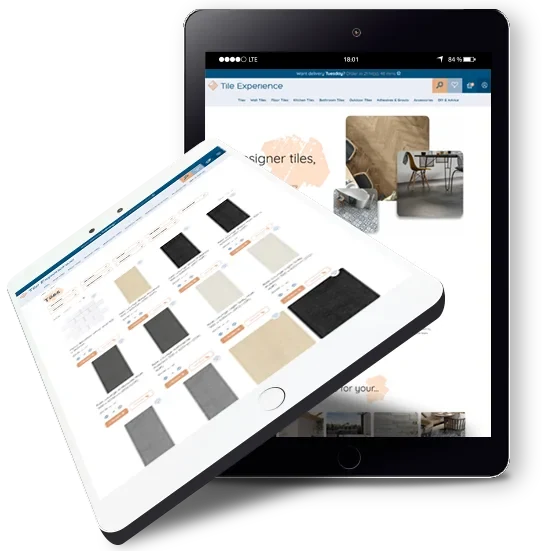
In April 2015 we started to manage the Tile Experience Google Ads account. As well as a wide range of floor and wall tiles, the client sells related products such as adhesives, grout and underfloor heating.
The account consisted of Search and Shopping campaigns, the latter only active since the end of 2014. While the Shopping campaign was performing well, the spend on Search was too high for the number of orders it generated, with an average cost per order of £95 in the first quarter of 2015, compared to just £20 in Shopping. The aim was to bring the cost per order down in Search to make it profitable.
The Results
3x
revenue in five years
27% to 20%
Cost/revenue ratio in Search during 2015
+43%
Revenue growth in 2020
+13%
Cost increase in 2020
14%
Spend/revenue ratio in 2020
Improved ROI in Search
By improving the Quality Score through restructured campaigns and new ad groups with ads more relevant to the keywords, we improved the CTR while bringing down the average CPC. Together with bid management that took into account the varying conversion rates of different ad groups and keywords, we increased traffic at a similar cost, and revenue grew as a result. The cost/revenue ratio dropped from 27% in the first quarter of 2015 to around 20% for the remainder of the year.
Through continuous improvement of the account and bid management we brought the CPC down further in 2016, while traffic and revenue increased at a similar spend/revenue ratio. Further growth followed in the years after, pushing more on Shopping, which still had the better performance.
Cost/Revenue Ratio
Ad spend as a percentage of revenue from Google Ads. Lower is better: more revenue for every pound spent.
During 2015, by quarter
After restructuring the Search campaigns
View the data as a table
| Quarter | Cost/revenue |
|---|---|
| Q1 | 25% |
| Q2 | 18% |
| Q3 | 19% |
| Q4 | 17% |
2015 to 2020
Year by year, as the account grew
View the data as a table
| Year | Cost/revenue |
|---|---|
| 2015 | 22% |
| 2016 | 21% |
| 2017 | 20% |
| 2018 | 20% |
| 2019 | 18% |
| 2020 | 13% |
43% Revenue Growth in 2020
In the last couple of years we have been splitting Shopping into separate campaigns for product brand and non-brand searches for many of our clients, including Tile Experience. With conversion rates often higher on product brand searches, we could push bids up for those searches to take advantage of the better performance, while pulling back and reducing cost on non-brand searches.
This has been very successful and has helped the account continue to grow, with a further 43% increase in revenue in 2020 while cost increased by only 13%. As a result the spend/revenue ratio fell to just 14% in 2020.

Combining Sayu Tools with Google's Segmented Data
We are continuously looking for improvements, making use of our own in-house tools as well as the detailed data Google provides, such as demographics and in-market and affinity audiences.
This enables us to set bids higher for demographics and audiences that convert better: another way to keep growing the account.
Explore PPC Management