
Journalists: We'll Do the Data Legwork
Got a story that needs numbers behind it? Tell us the question and your deadline. Sayu's data team will find, clean and analyse the figures, cut them by region if you need it, and send back data you can check for yourself. It's free. If you use it, we just ask you to credit the source.
Tell Us What You Need
Send us the outline. We'll reply within one working day with what's possible and when.
- 1We reply with what the data can and cannot show
- 2We agree the scope, format and deadline with you
- 3We send the findings, the data and a method note
- 4You credit the source if you use it
Prefer email? press@sayu.co.uk
Thanks, your request is in
We'll reply within one working day, sooner if your deadline is tight.
The Deal
What you get
- Research done to your brief and your deadline
- Figures you can check, with every source listed
- Regional cuts, charts or a map on request
- No fee, and no obligation to use it
What we ask in return
- Credit Sayu, or the expert we put forward, as the source
- A link to the method page where your outlet allows
- A quick heads-up when the piece runs
Our ground rules
We only send figures we can stand behind, and we'll tell you if the data doesn't support an angle. We never invent numbers, and we won't offer work done to your brief to anyone else before you've run it.
How It Works
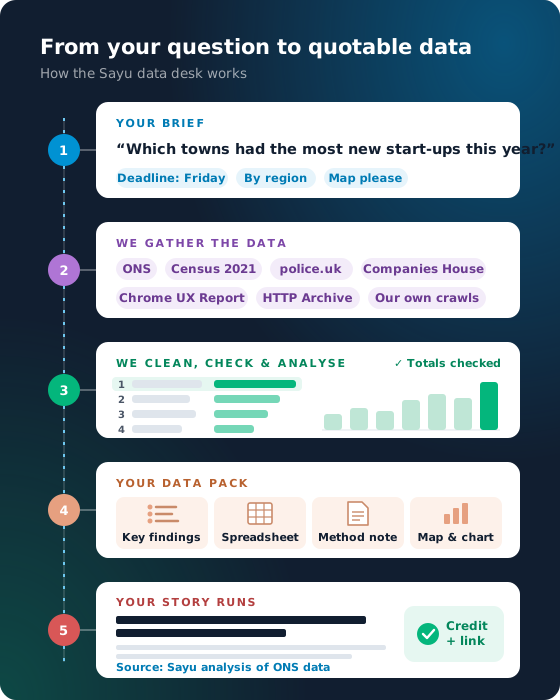
From your first message to figures you can quote, usually in days rather than weeks.
- 01
Send the brief
Tell us the topic, the question you want answered, the area it covers and your deadline. A rough idea is fine.
- 02
We check it can be done
Within one working day we tell you what data exists, what it can and can't show, and when we can deliver.
- 03
We do the legwork
We pull official and open data, clean and join it, run the analysis and cut it by region, town or sector.
- 04
You get the pack
Key findings, a tidy spreadsheet, a short method note and a chart if it helps, ready to check and quote.
- 05
Credit the source
If you use it, credit Sayu, or the expert we put forward, and link to the method page where your outlet allows.
What We Can Dig Into
Some of the requests we can turn round quickly. Each one starts with your question, not ours.
Where in the UK?
Which towns have the most new businesses, crime or empty shops? We rank places on official data and show your patch.
Where in the UK?
We work from sources such as the ONS, Census 2021, police.uk and Companies House, so every number can be traced. Rankings can be by council, town or region, with the figure for the area your readers care about.
- Rankings by council, town or region
- Your area's figure and how it compares
- A map or table you can embed
Business Trends
New companies, closures and sector shifts from Companies House, month by month and area by area.
Business Trends
We track company formations and dissolutions by sector and place. Our own study found online shops made up nearly one in ten new UK companies.
- Start-ups and closures by sector
- Month-by-month trends
- Local and national cuts
How the Web and AI Behave
Which sites block AI crawlers, how fast pages load on phones, which sources AI assistants quote. We measure it ourselves.
How the Web and AI Behave
We run our own crawls and use Chrome UX Report and HTTP Archive data covering millions of sites, so tech and consumer stories can lead on fresh numbers.
- Our own crawls of UK websites
- Chrome UX Report and HTTP Archive
- What ChatGPT, Gemini and others cite
What People Search For
Search interest over time and by region, showing what the public is really worried about or buying.
What People Search For
Search data is a quick way to show public interest in a topic. We compare terms, track seasonal peaks and break interest down by region.
- Trends over time and by region
- Terms compared side by side
- Seasonal peaks and spikes
Your Own Data, Checked
Got a spreadsheet, FOI response or survey? We clean it, check the sums and find the angles that stand up.
Your Own Data, Checked
We check totals, flag gaps and outliers, and join your figures to population or area data so places can be compared fairly. Then we tell you which findings hold up and which don't.
- FOI responses and survey results
- Per-head and fair comparisons
- An honest read on what holds up
Expert Comment
Need a quote to go with the numbers? We can put forward a Sayu specialist or a relevant expert from one of our clients.
Expert Comment
We work with businesses across retail, travel, finance, property and more. If one of them knows your subject, we can line up a short, on-the-record comment to fit your deadline.
- Digital, search and AI specialists
- Industry experts from our clients
- Comments that fit your deadline
Studies We've Already Run
Recent examples of data we have collected and analysed ourselves, each with the figures and the method behind it.

Biggest .uk websites twice as likely to block AI crawlers
Read More
Online shops made up nearly one in ten new UK companies
Read More
AI chat apps cite gov.uk most for everyday UK questions
Read More
Seven in ten UK-visited websites pass Google's phone speed test
Read More
PayPal leads payment code on .uk home pages as Stripe slips
Read More
Most sites AI assistants cite for UK searches miss Google's top 10
Read MoreQuestions From Journalists
Yes. Good journalism that cites our work builds our reputation, and that's the return we're after. There's no fee, and you're under no obligation to use what we send.
A straightforward pull from official data can often be done in a day or two. Bigger pieces, such as a fresh crawl or combining several sources, take longer. We'll give you a realistic date before we start, and tell you straight away if we can't make your deadline.
Official and open sources such as the ONS and Census 2021, police.uk, Companies House, the Chrome UX Report, HTTP Archive and Cloudflare Radar, plus our own crawls and search data. The method note lists every source, so you can check the figures yourself.
We'll tell you, and suggest what the data does show. We report the numbers as they are; we don't stretch them to fit a headline.
Usually Sayu, as the agency that ran the analysis. Sometimes the best expert is one of our clients, such as a retailer commenting on its own sector; in that case we agree the credit with you before you file.


